Posts

Attribute Data Management
Image
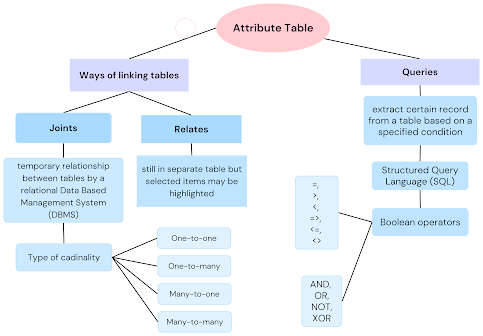
  Attribute data refers to non-spatial information that provides details about a spatial feature. Spatial data includes both location information and additional attributes accompanied with it. There are two methods for linking the tables: joining and relating. Joining a table involves establishing a  temporary relationship between tables through a relational Data Based Management System (DBMS). The tables need to have a common field and the original stored data remains unaffected. Calculation views can apply a cardinality setting to joins which specifies the number of matching entries in the other tables for each entry in one table. Cardinality types include one-to-one, one-to-many, many-to-one and many-to-many. On the other hand, relating tables are similar to joins but the tables remain separate and selected items in one table may be highlighted in the table.  A query is used to extract specific records from a table based on specified conditions. Many databases utilize ...

Raster Geoprocessing Toolkit

Image
  In GIS, there are two types of basic geoprocessing with raster data analysis: single layer analysis and multiple layer analysis. For the single layer analysis, reclassification or recoding is basically assigning a new range of values to all pixels in the dataset based on their original values. This simplification allows for fewer unique values and cheaper storage requirements. Buffering for raster data tends to approximations representing those cells that are within the specified distance range of the target. For the multiple layer analysis, the clipping process of raster data results in a single raster that is identical to the input raster but shares the extent of the polygon clip layer. The overlay process of raster data is that the number within the aligned cells of the input grids can undergo any user-specified mathematical transformation. The Boonlean raster overlay methods can use the connector (AND, OR and XOR) to combine the information of two overlying input raster data ...

Project 3: Soil Erosion Analysis

Image
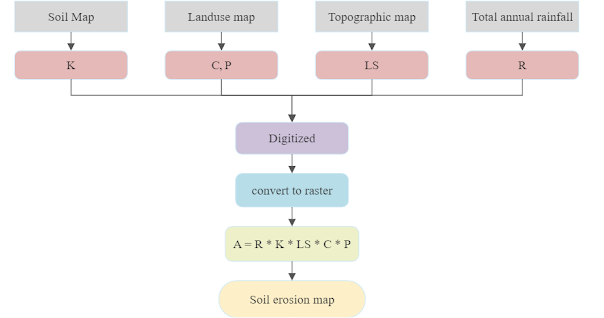
Upon initial observation, Kampung X is currently facing a severe issue with erosion. As a researcher assigned by the Department of Agriculture Malaysia, my responsibility entails 1the task of conducting studies on the soil erosion rate from 1990 to 2010. The Revised Universal Soil Loss Equation (RUSLE) is used as it can estimate erosion and plan conservation measures by predicting the amount of soil loss in specific fields with specific slopes. This equation utilizes five key factors that can be assigned numerical values to predict the soil loss at a given location. The soil loss is calculated as follows: A = R × K × LS × C × P   where A is annual soil loss (tons/ha/yr),  R is the rainfall erosivity factor,  K is the soil erodibility factor,  LS is slope length and steepness factor,  C is cropping and management factor, and  P is conservation supporting practices factor (Yoder and Lown, 1995) Rainfall erosivity (R) factor is the index that measures th...

Vector Geoprocessing Tools

Image
A geoprocessing tool is one that systematically manipulates either the geometry or the attribute information or both of a vector GIS data file. It is used to perform various spatial operations and analyses on vector data. These tools allow for tasks such as buffering, clipping, merging, intersecting, dissolving, and more. They provide the means to extract, transform, and analyze data within a geographic context, facilitating effective spatial analysis and decision-making processes.   The photo above clearly shows the function of the 6 basic toolkits. Basic six toolkits Buffer - creates a geometric area around vector features by using points, lines or polygons (input) at a specified distance of a feature or features (buffer width) - can create variable distance buffers based on attribute value  - use equidistant projection to center the point from that point, know the scale well and can draw buffer Clip   - subset tool - large dataset to clip down into smaller subset/datas...

Project 2: Land use change analysis

Image
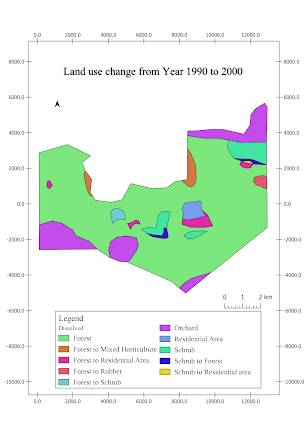
    To analysis the land use change by using GIS The land use change map  for the Year 1990 to 2000, 2000 to 2010, and 1990 to 2010 are created using QGIS . The graph of land use changes for the Year 1990 to 2000, 2000 to 2010, and 1990 to 2010 are drawn by using Microsoft Excel .  Diagram above shows the map of land use change from the year 1990 to 2000. Graph above shows the area change (hectare) of land use change from the year 1990 to 2000. Diagram above shows the map of land use change from the year 2000 to 2010. Graph above shows the area change (hectare) of land use change from the year 2000 to 2010. To get a better visual for soil erosion change for the past 20 years, a map and a graph is drawn.  Diagram above shows the map of land use change from the year 1990 to 2010. Graph above shows the area change (hectare) of land use change from the year 1990 to 2010.      From the graphs, the area of forest is the largest and the orchard has ...

Map projection

Image
Geographic Coordinate System It is the reference system for locating spatial features on the Earth's surface. It can be defined by longitude ( 0 to 180 degree of east or west ) and latitude ( 0 to 90 degree north and south ). The location of map features can be expressed in x-coordinate and y-coordinate . Earth's shape is not a perfect sphere but is approximately a spheroid, known as an ellipsoid. Map Projection A map projection is a method of representing the three-dimensional surface of the Earth (geographic coordinates on an ellipsoid) onto a two-dimensional map (locations on flat-surface). After projection, at least one of the factors ( size, shape, distance  and  direction ) will be distorted. There is no single "perfect" map projection, as the choice of projection depends on the intended use of the map and the areas of the world that need to be shown accurately. Type of map projection: Conformal projection (preserve angles and shapes) Equivalent projection ...

Project 1: UPM Dihatiku

Image
Introducing my faculty - Faculty of Forestry and Environment To create a simple map, digitizing is the necessary task that needed to be done. Digitizing a map involves converting the raster image to vector data or layers.      By using the QGIS, the QuickMapServices plugin needed to be installed. This plugin is useful as it provides base maps from many sources such as Google Maps, OpenStreetMap, Bing Maps, and many others.      For this project, Google Satellite is used. A satellite image will be displayed and a new layer is created.     Then,  Lat Lon tools plugin is installed. It is a useful plugin for QGIS that provides additional functionality for handling geographic coordinates such as converting between coordinate formats, displaying coordinates in different formats, calculating distances and bearings, and creating custom grids and reference systems.       To search for the location of my faculty, Google Map...

Introducting QGIS

Image
 Introducing QGIS  It is a free and open-source Geographic Information System . It is a cross-platform desktop GIS tool that allows users to view, modify, and analyse geographical data.  It lets users examine and update geographical data, as well as create and export graphical maps. This is the QGIS page once users open after downloading and installing. To understand the basics of the QGIS user interface The names and functions of: 1. The map canvas the area of red colour displays the map and layers 2. The status bar the area of green colour shows the information about the coordinate system, map scale, magnifier coordinates, map rotation, rendering behaviour and the current CRS (with the EPSG code). 3. The locator bar the area of blue colour can search from layers to tools To familiar with the QGIS interface This is the first lab assessment that after trying to add other layers from the Malaysia boundary shapefile folder and exporting the selected features (selected...

Map Design

Image
  These properties affect the context of data display in maps.  Map Design Process: Determine where, what and when of the map will be produced. Choose a scale and map projection. Classify the data and use suitable symbols to represent the features. Choose the map elements properly and implement them. Establish Intellectual Hierarchy. Sketch maps. Construct maps. Intellectual Hierarchy: Most important      -      Thematic symbols and type labels                                         -     Title, subtitle and legend                                         -     Basic information (boundaries, roads, etc.)                      ...

Geospatial Data

Image
  From the photo above, there are two types of geospatial data: spatial data and attribute data .  Spatial data:  any type of data that can be linked to a specific location or geographic area. Attribute data:  includes a wide range of information that describes characteristics of spatial features. There are two types of spatial data: vector data and raster data. Vector data can be represented by points, lines, and polygons .               Points represent individual locations or features, such as wells, benchmarks, and gravel.              Lines represent linear features, such as roads, rivers, contour lines, and pipelines.               Polygons represent areas, such as the boundaries of a city, a park, water bodies, or a land parcel. Raster data are represented as a grid of cells, where each cell is called a pixel and represents ...