Project 3: Soil Erosion Analysis
Upon initial observation, Kampung X is currently facing a severe issue with erosion. As a researcher assigned by the Department of Agriculture Malaysia, my responsibility entails 1the task of conducting studies on the soil erosion rate from 1990 to 2010. The Revised Universal Soil Loss Equation (RUSLE) is used as it can estimate erosion and plan conservation measures by predicting the amount of soil loss in specific fields with specific slopes. This equation utilizes five key factors that can be assigned numerical values to predict the soil loss at a given location.
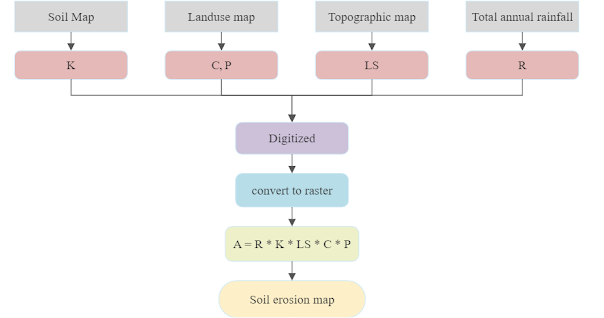
The soil loss is calculated as follows: A = R × K × LS × C × P
where A is annual soil loss (tons/ha/yr),
R is the rainfall erosivity factor,
K is the soil erodibility factor,
LS is slope length and steepness factor,
C is cropping and management factor, and
P is conservation supporting practices factor (Yoder and Lown, 1995)
Rainfall erosivity (R) factor is the index that measures the erosion force of specific rainfall events. The relationship between the rainfall erosivity index and mean annual precipitation for Peninsular Malaysia can be represented by the following regression equation (Morgan, 1974):
R = P/2 , where P represents annual total rainfall in millimeters (mm).
After analysing the 15 years’ rainfall data, P is found to be 2200 mm, and R is calculated as 1100.
Soil erodibility (K) factor represents the average long-term response of soil and soil profiles to the erosive power associated with rainfall and runoff. It is also the mean annual soil loss per unit of R for a standard condition of bare soil.
Next, the elevation layer is generated using contour data and it is subsequently clipped to remove any excess elevation data outside the border of the study area. After the clipping process, LS factor layer is generated.
LS factors are the slope length factor in which L and S evaluate the effect of slope length and steepness on erosion. The values of L and S are relative and represent the relative erodibility of the a particular combination of slope length and steepness (Wang et al., 2001).
P represents the influence of support practices on the average annual erosion rate. It quantifies the proportionate reduction in erosion achieved when specific practices are implemented, as compared to the erosion that would occur in their absence (Troch et al., 1999).
On the other hand, the factor C, known as the cover management factor, is utilized to assess the impact of cropping and management practices on erosion rates. C is commonly employed to compare the relative effects of different management options within conservation plans.
After that, the soil erosion is calculated by using the formula: A = R × K × LS × C × P.
The potential erosion values are divided into seven classes, from erosion class 1 of very low erosion potential to class 7 of exceptional erosion potential.


Soil erosion analysis is crucial for city planning as it assesses erosion risks and impacts on urban infrastructure and the environment. It helps identify erosion-prone areas, allowing informed decisions on infrastructure placement and design. This ensures infrastructure is built in less vulnerable areas and appropriate erosion control measures are implemented. Soil erosion also has ecological consequences, such as loss of topsoil and habitat degradation. By incorporating soil erosion analysis, city planners can identify environmentally sensitive areas at risk and protect natural spaces, wetlands, and wildlife habitats, minimizing environmental impact in urban development.


Comments
Post a Comment