Project 2: Land use change analysis
To analysis the land use change by using GIS
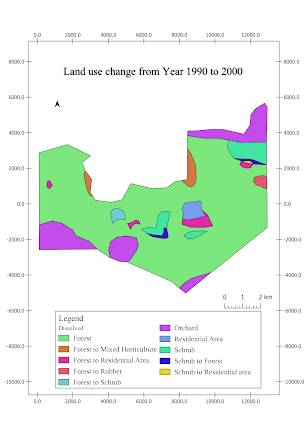
The land use change map for the Year 1990 to 2000, 2000 to 2010, and 1990 to 2010 are created using QGIS. The graph of land use changes for the Year 1990 to 2000, 2000 to 2010, and 1990 to 2010 are drawn by using Microsoft Excel.
From the graphs, the area of forest is the largest and the orchard has the second largest area no matter from the year of 1990 to 2000, 2000 to 2010, and 1990 to 2010. However, the area of forest decreases significantly to 4852.72 hectares. The graphs and tables show that the area of the forest is changed for other usages, such as shrubs, rubber, residential area and mixed horticulture.
The reduction in forest area can occur through natural processes or human actions, leading to the establishment of shrubs that replace the original forest vegetation. The conversion of forests into rubber plantations may be driven by economic factors. Forests may also be cleared and converted to residential areas in response to urban growth and population increase. Additionally, forest areas can be transformed into mixed horticulture systems, involving the cultivation of various crops for commercial purposes, often replacing the original forested landscape.
In GIS, there is Union and Dissolve Analysis for this particular project. Essentially, "Union" is a type of analytical procedure that merges the features of two or more map layers into one composite layer. This can be useful for integrating different data sources or combining spatial information from various datasets. By performing a Union, the resulting layer will contain all the attributes and geometries from the input layers.
Meanwhile, "Dissolve" is a technique that creates a new map feature by merging adjacent polygons, lines, or regions that share a common value for a specified attribute. This process simplifies the representation of the data by reducing the number of individual features.


Comments
Post a Comment